The concentration of most of the world’s orange production in a few places (Brazil, the United States, China, the European Union, and Mexico) results in extreme sensitivity to weather and diseases, as one freeze or hurricane can wipe out an entire crop, making frozen concentrated orange juice (FCOJ) future price volatility high.
Florida is the largest producer of oranges in the United States and the second largest producer of orange juice in the world after Brazil. Around 90 percent of the oranges produced in Florida are processed into juice, and frozen concentrated orange juice (FCOJ) is traded in the International Commodity Exchange (ICE).
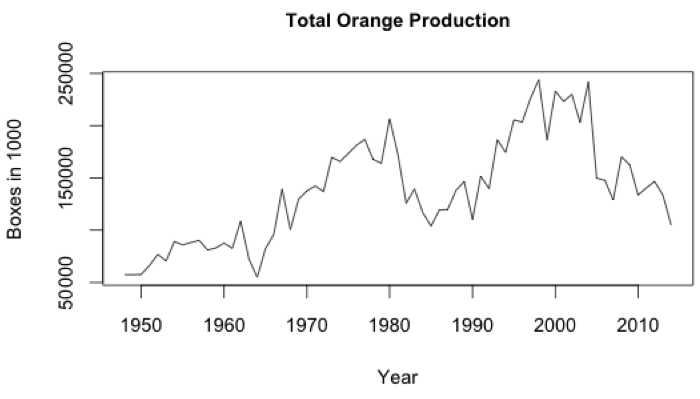
Over the last decade, orange production in Florida has declined, in part due in part to some significant extreme weather events (Figure 1). The 2004-2005 hurricanes (Charlie, Frances, and Wilma) greatly affected production, almost to the same degree as devastating freezes that hit the State in the 1980’s. Diseases have also played an important role in the production decline. The citrus greening disease (Citrus Huanglongbing), which causes premature fruit drop and higher tree mortality, has affected orange production in Florida since 2005 when it was first spotted.

The United States Department of Agriculture (USDA) issues citrus production forecasts on the second week of each month from October to July, and provides a statewide estimate for different types of citrus fruit. The estimates are used for planning purposes by various stakeholders in the orange and orange juice value chain.
In the past decade,however, the combination of extreme events, diseases and other fluctuations in weather has raised the error of the USDA October forecast. The production was significantly underestimated when the hurricanes hit in 2004 and 2005, and again in 2013 and 2014 mainly due to the effects of citrus greening. The error of the total orange production forecast ranges from 1.3 percent below to 19.4 percent above.
In this work the CWC developed models to predict the directionality and magnitude of the USDA October citrus forecast based on climate variables occurring before and after the forecast is issued. This model could be used to inform sourcing/trading/hedging decisions affecting farmers, orange processors, and traders. As part of the project, an Orange Visualization tool, along with a Orange Visualization tool manual, was developed in RShiny to visualize trends in yield, drop rates, production, and different climate variables at the State and County Levels. This tool allows assessments of the correlations between a set of relevant climate parameters and orange yield/forecast error at different growth stages. Automated predictions of the USDA October forecast error direction and magnitude can also be obtained with the tool, which makes it a valuable resource for various stakeholders in the orange business.
