Given increasing water scarcity and the associated deterioration of the quantity and quality of water sources in many parts of the world, many “tools” have been developed to map water scarcity risk or water risk. Typically, these tools are based on estimates of the average water supply and demand in each administrative jurisdiction. Often, water risk is basin-wide, while decisions are made at the city or county level. Therefore, the analyses on which such tools are based understate the potential water risk. In most places, even if the resource is not over-appropriated on average, persistent shortages induced by climate variation can lead to stress. A clear understanding of shortages, in terms of the magnitude, duration and recurrence frequency will better inform localities.
To properly diagnose water risk, Columbia Water Center researchers examined both existing demand and variations in renewable water supply at appropriate spatial resolution and unit. A metric that can inform the potential severity of a shortage is the accumulated deficit between demand and supply at a location. Here, we provide ways to estimate this risk and map it for the USA at a county level.
While industry accounts for only 18% of direct water use, industrial supply chains may have more water risk due to climate variability. Reliance on imported river water or mined ground water hides the true risk to supply chains through the communities which share water supplies. It is important to expose the underlying water stress in the face of spatial competition for existing water resources.
Unlike past work that considers estimates of groundwater recharge and river flow as measures of supply, we use precipitation as the renewable water supply endogenous to the area, and consider natural and human uses of this water.
It is important to realize at this juncture that while water supply entails physical and institutional settings with defined water rights in some regions, incorporating such appropriations and institutional factors is a challenge given the lack of a comprehensive data source for such non-physical factors. Moreover, contrary to most applications of water risk indices, for our application, we are considering the supply to be defined by the rainfall over the accounting unit (i.e. the county). We did not consider additional sources such as canals or rivers coming into or leaving the county since constraining the hydrologic approach at daily scale and a fine scale accounting unit is a challenge. For instance, if one took account of all stores and fluxes to assess stress, one would need to consider also the fluxes in and out of the deep groundwater, shallow groundwater and natural and manmade reservoirs, and estimating these reliably is a challenge. Moreover, while water balance terms define actual water stress, this would be conditional on allocation or operation rules which are usually not available nationally.
Changing the question to “how sustainable are the water resources in this accounting unit, if we consider only the renewable endogenous supply as defined by the rainfall in the unit”, allows for a more direct assessment. This takes away the endowment issues and implicitly reveals dependence on exogenous supplies.
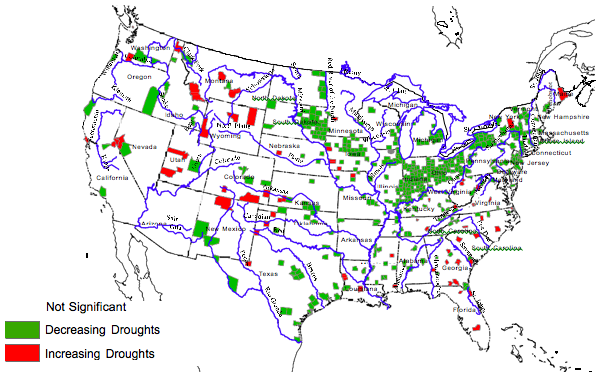
<br>Lower Panel: Multiyear cumulative analysis (NDC) for 1949-2009 daily supply and demand data.")
D. Shi, N. Devineni, U. Lall and E. Piñero Columbia Water Center Whitepaper in conjunction with Veolia Water America’s Water Risk: Water Stress and Climate Variability